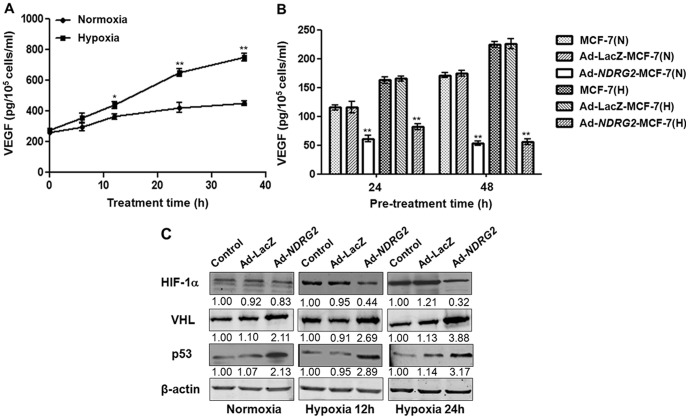
Figure 4. Effect of Ad-NDRG2 on the expression of VEGF, HIF-1α, p53, and VHL under normoxia or hypoxia.
(A) MCF-7 cells were incubated for the indicated time (0, 6, 12, 24, 36 h) in normoxic (21% O2) or hypoxic (1% O2) conditions. After incubation, the media were analyzed for VEGF levels by ELISA assay, and the cell number was counted. (B) MCF-7, Ad-LacZ-MCF-7 and Ad-NDRG2-MCF-7 cells were incubated for the indicated time (24, 48 h) in normoxic or hypoxic conditions. After incubation, the media were analyzed for VEGF levels by ELISA assay, and the cell number was counted. The data are the mean ± standard deviation (SD) for three independent experiments. Statistical significance was assessed with one-way ANOVA and Student's t-test. * or ** indicates P<0.05 or P<0.01, respectively, when compared with the normoxia or Ad-LacZ-MCF-7 group. N, normoxia; H, hypoxia. (C) MCF-7, Ad-LacZ-MCF-7 and Ad-NDRG2-MCF-7 cells were incubated under hypoxia for 0, 12, or 24 h. After incubation, the cells were analyzed by western blot assay. β-actin protein levels were used as a loading control.

