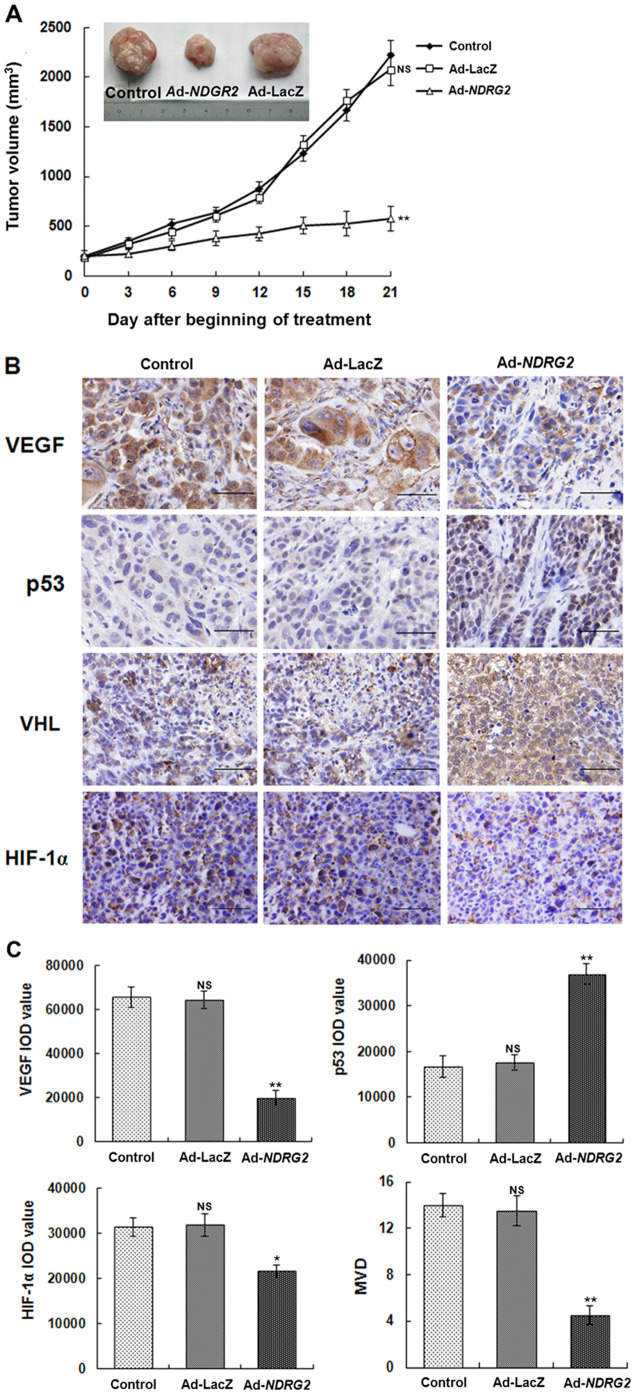
Figure 5. Effects of intratumoral injections of Ad-NDRG2 on the growth and vascularization of MCF-7 cell xenografts in mice.
These experiments were described in “Materials and Methods”. (A) Tumor growth curve. The tumor growth was assessed every 3 days until Day 21 of treatment by measuring two perpendicular diameters and calculating the volume in mm3. Statistical analysis was performed using Day 21 values only, with one-way ANOVA and Student's t-test. ** indicates P<0.01 when compared with the control. The typical photographs of tumors are shown. (B) Intratumoral vascularization was assessed by VEGF, p53, VHL, and HIF-1α immunolabeling (400× magnification) on paraffin-embedded MCF-7 cell tumor sections. Representative images are shown. (C) Integrated optical density (IOD) values of VEGF, p53, VHL, HIF-1α protein expression and MVD of the tumors were evaluated. ImagePro Plus software was utilized to analyze the IOD values of the positive areas of immunohistochemical staining, and the resulting histograms are shown. After areas containing dense vascularity, either within the tumor or during different pathological stages, were selected using a microscopic field with 100× power, all brown-stained vessels were counted under three fields with 200× power. The mean value of the vessels in the three fields was taken as the MVD count of a tumor. The histograms are shown. Statistical analysis was carried out using one-way ANOVA. The results are shown as the mean ± SD from a total of six mice. *P<0.05 or **P<0.01.

