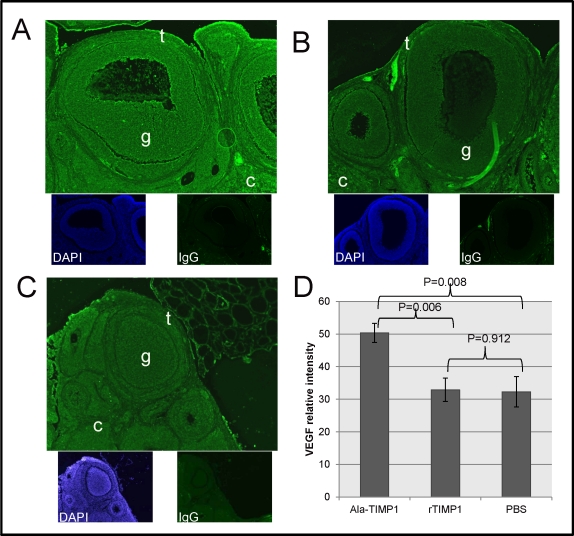
FIG. 2.
VEGF protein immunolocalization and quantification by morphometric analysis. A) More fluorescent intensity of VEGF (green) localized in ovaries from Ala-TIMP1-treated rats compared with ovaries from (B) rTIMP1-treated rats or (C) PBS-treated rats. Theca (t), granulosa (g), and ovarian cortex (c) are marked. The bottom images in A, B, and C show nuclear staining (4′,6-diamidino-2-phenylindole [DAPI], blue) and a negative control using IgG, as indicated. Original magnification ×100. D) Quantitative analysis shown in graph (ANOVA: P = 0.004).

