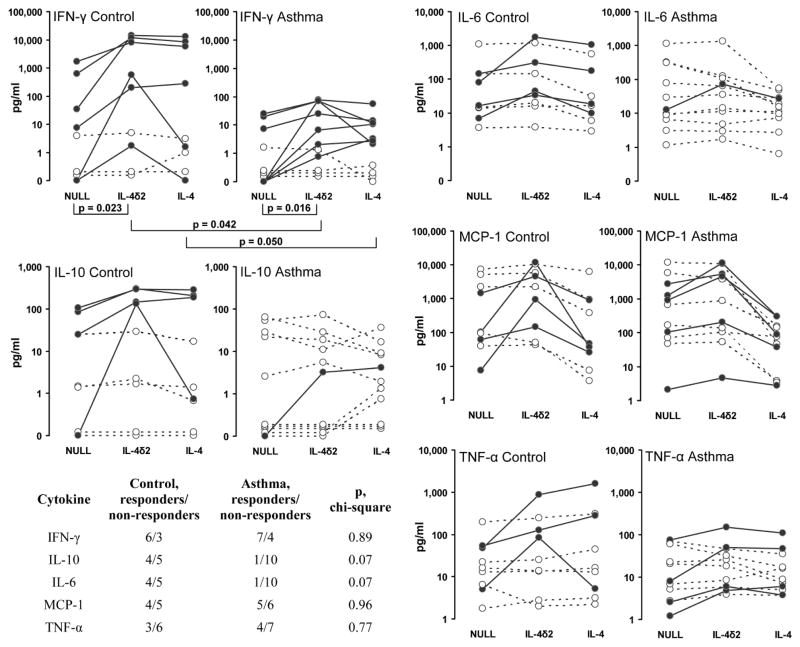
Figure 5.
The levels (pg/ml) of indicated cytokines in the supernates of purified T lymphocytes from patients with asthma and from healthy controls following activation with rhIL-4δ2 or rhIL-4. Responders, defined as those cultures in which the cytokine levels changed 2 fold or more in response to stimulation with IL-4δ2 for 48 h, are shown as filled circles connected by solid lines, whereas non-responders are shown as open circles connected with dashed lines. The Wilcoxon signed rank test was used to assess the effects of stimulation within the control and asthma groups, whereas Student’s two-tailed t-test was used to compare cytokine levels in cultures from patients with asthma versus cultures from healthy controls. The table in the lower left corner shows the differences between asthma patient and control groups in the numbers of responders and non-responders and the significance of these differences according to the chi-square test.

