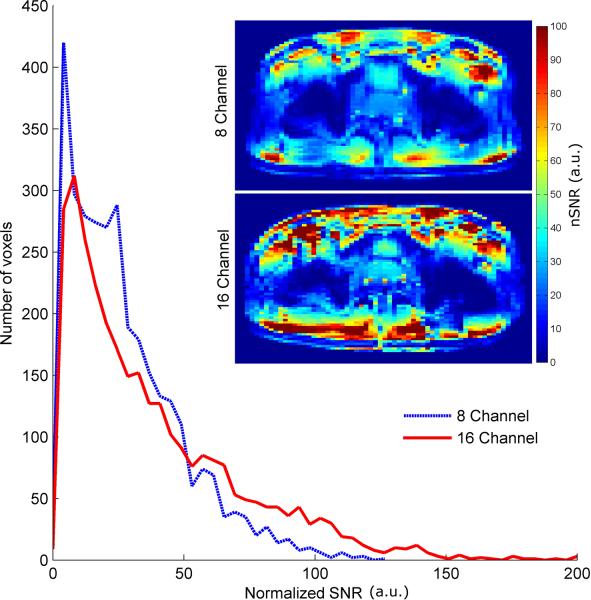
Fig. 5.
Histogram of all nSNR values derived from the long repetition time GRE acquisition for both the eight- and sixteen-channel arrays. Both of the nSNR images used to generate the histrogram are shown as insets. Both the images and histogram demonstrate the increased receive performance of the sixteen-channel array in the periphery. This data was acquired to better demonstrate the receive performance across the torso as it is independent of T1 weighting.

