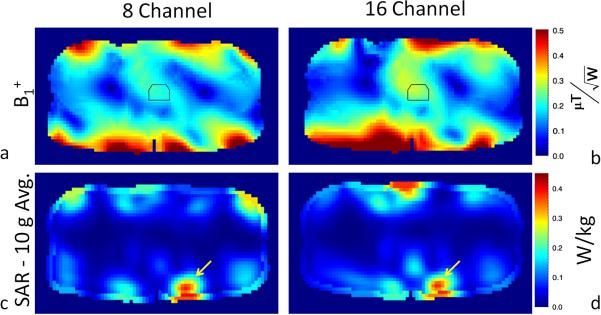
Fig. 6.
Simulation results for the (a) eight- and (b) sixteen-channel arrays in terms of transmit B1 normalized by input power. 10 gram averaged SAR normalized by input power for the (c) eight-and (d) sixteen-channel arrays. The location of maximum SAR in each of the images (c–d) is indicated with a yellow arrow and the value's maximum local SAR normalized to 1 W input power are given in table 2.

