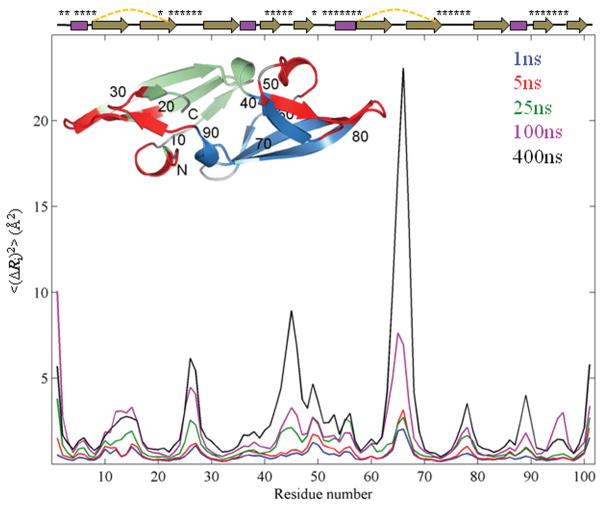
Figure 2.
Mean-square-fluctuation profiles of CV-N from simulations with different durations. The MSFs <(ΔRi)2> of residues averaged over twenty independent 1 ns, sixteen 5 ns, twelve 25 ns, eight 100 ns and two 400 ns runs are shown in blue, red, green, magenta, and black, respectively. Secondary structure elements of the protein are depicted at the top with disulfide bonds represented by dashed yellow lines and residues in the sugar binding sites labeled by asterisks. The inset shows the CV-N structure in ribbon representation. Domains A and B are colored green and blue, respectively, and the two sugar binding sites are colored red. Amino acid sequence positions are labeled for every 10th residue.

