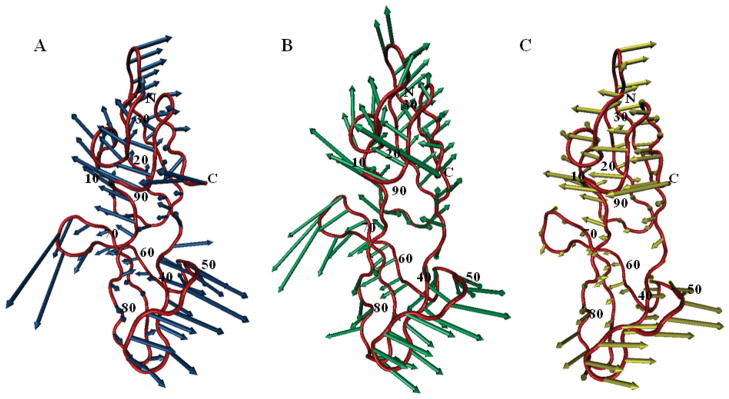
Figure 5.
Shared global mode between theory and simulations. The CV-N backbone structure is shown in tube representation (red) with the directions of the global motion for the 1 ns simulation (A) and the 400 ns simulation (B), or the second mode predicted by the ANM (C) depicted by blue, green, and yellow arrows, respectively. The correlation coefficients between pairs of modes displayed are 0.77 (blue/green), 0.69 (blue/yellow), and 0.64 (green/yellow). Primary sequence positions are labeled for every 10th residue.

