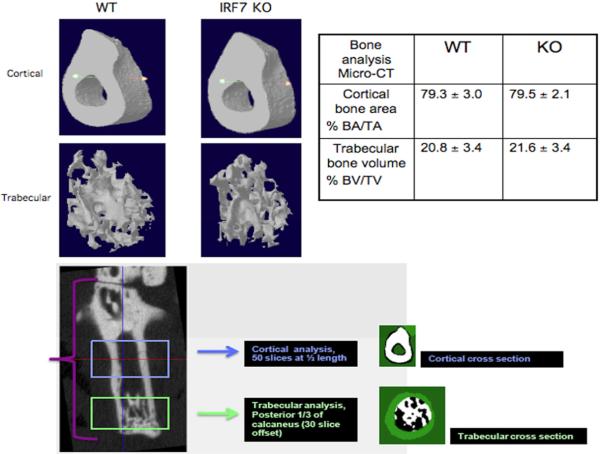
Figure 2.
Visualization, 3D reconstruction, and quantification of serum transfer induced joint damage by microcomputed tomography. Representative images of arthritic WT and Irf7−/− mice (n=5 each) cortical and trabecular bone are shown in upper left images. Percent cortical bone area and trabecular bone volume calculations are shown in the table on the upper right. No significant difference between WT and IRF7 KO cortical bone area or trabecular bone volume was detected. The lower image demonstrates the regions of micro-CT used for cortical and trabecular bone analysis.

