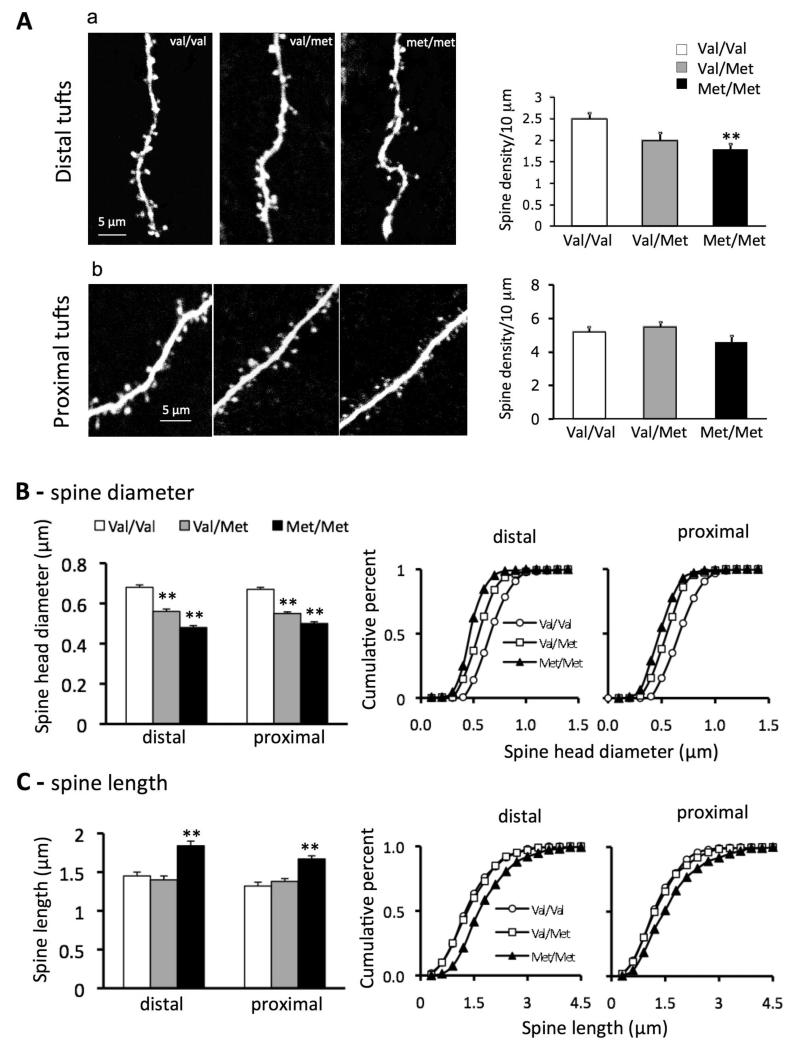
Figure 2. BDNF Val66Met knock-in mice have deficits in spine density and spine morphology in apical tuft dendritic branches of layer V mPFC pyramidal cells.
A. Representative images showing spine density and morphology in distal (a) and proximal (b) tuft dendrites in Val/Val, Val/Met and Met/Met groups; adjacent bar graphs comparing spine density in distal and proximal zones in the three groups of mice. Note: dendritic spine density is reduced in distal but not proximal apical tuft in Met/Met mice (Met/Met, 1.9 ± 0.2 / 10 μm; Val/Val, 2.5 ± 0.12/10 μm; p = 0.02). B. spine diameter: Bar graphs (left) of spine head diameter showing a gene-dose dependent decrease in apical turf spine diameter for both distal Val/Val (0.68±0.012 μm) versus Val/Met (0.56 ± 0.012 μm) and Met/Met (0.48 ± 0.01 μm), and proximal Val/Val (0.67 ± 0.01 μm) versus Val/Met (0.55 ± 0.008 μm) and Met/Met (0.5 ± 0.009 μm) segments; cumulative fraction line graphs (right) for distal and proximal tuft segments showing gene dose-dependent decrease in spine diameter. C. spine length: bar graphs (left) showing an increase in spine length for Met/Met group only; cumulative fraction cline graphs (right) for distal and proximal tuft spine length; note increase in spine length only in the Met/Met group (1.84 ± 0.06 μm and 1.67 ± 0.04 μm) as compared to Val/Val (1.45 ± 0.05 μm, 1.32 ± 0.05 μm) and Val/Met (1.4 ± 0.05 μm 1.38 ± 0.04 μm) groups.

