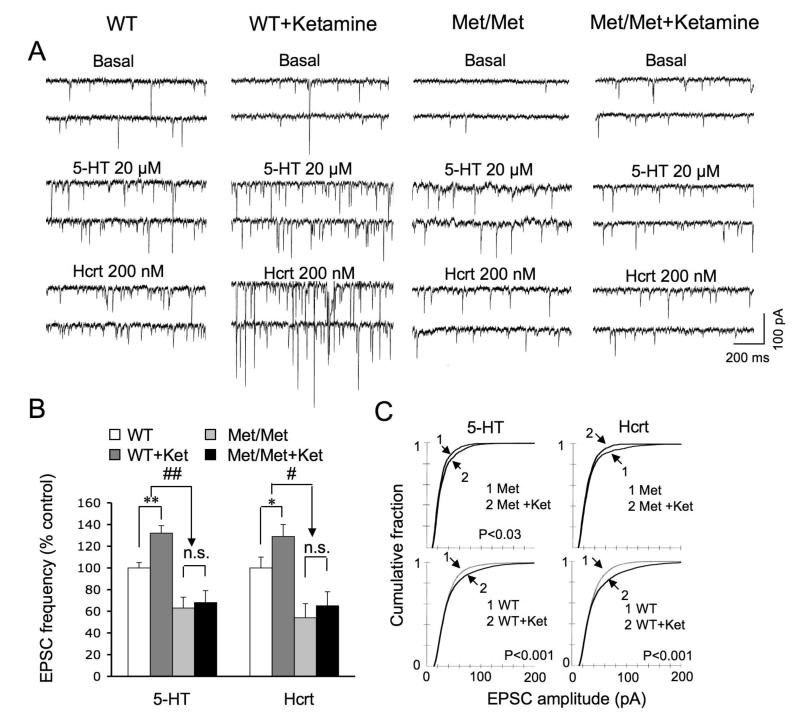
Figure 5. Ketamine-induction of EPSC frequency and amplitude are reduced or eliminated in BDNF Val66Met knock-in mice.
((A) Sample whole cell voltage-clamp traces of 5-HT and hypocretin-induced EPSCs in layer V cells from vehicle and ketamine treated Val/Val and Met/Met mice (24 hr post drug treatment); ketamine was administered as described in Figure 4. (B) Bar graphs showing, in contrast to Val/Val group, ketamine fails to increase the frequency of 5-HT- and hypocretin-induced EPSCs in the Met/Met group (n = 15 neurons/group; *p< 0.05, ANOVA), There was no significant difference between basal EPSC frequency in WT (6.1±1) vs, Met/Met (5±0.7) or WT+Ket (10.4±1.1) or Met/Met+Ket (8.3±0.9), although there was a trend toward a decrease in both cases. (C) Cumulative probability distributions showing the ability of ketamine to increase EPSC amplitude is substantially reduced in Met/Met group as compared to WT group. Note that 5-HT- and hypocretin-induced EPSC responses were from the same set of neurons that were analyzed for spine density in Figure 4.

