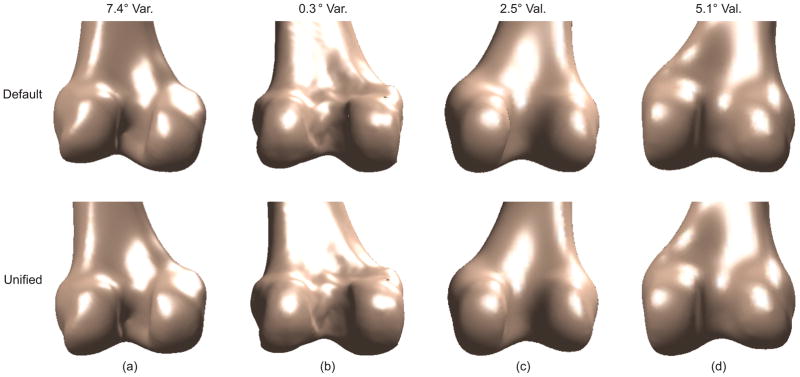
Figure 5.
Bone models before (top row) and after (bottom row) sagittal plane correction. The models are viewed from the posterior to show the varus-valgus rotational correction. The 4 cases are representative samples of the models with (a) maximum varus correction, (b) near zero varus/valgus correction, (c) correction comparable to the mean value, and (d) maximum valgus correction, respectively.

