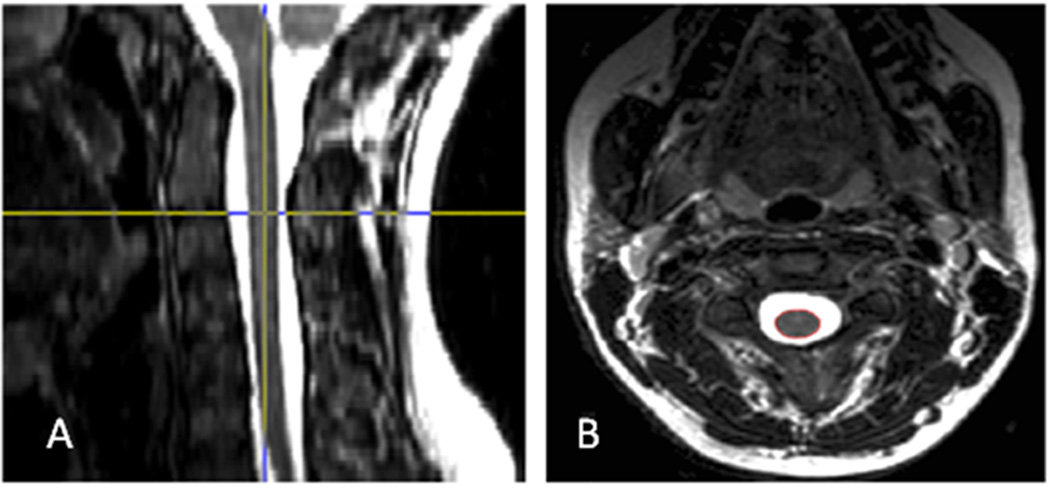
Figure 1. Representative spinal cord image.

Representative MRI images: The figure shows the native axial T2-weighted image (B) and the reconstructed sagittal view of the data set provided by a reslicing orthogonal tool (A). The localizing lines in the sagittal view were used to identify the anatomic level of the axial slices. Then using an edge finding tool based on local thresholding, the spinal cord contour was identified, resulting in a region of interest (in red) in the axial image.
