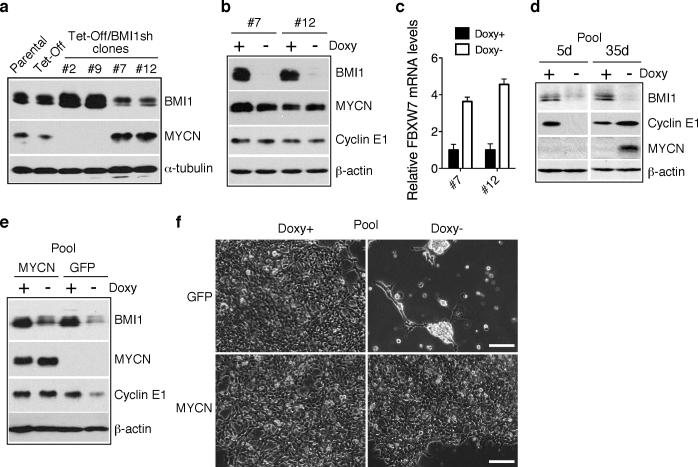
Figure 4.
MYCN counteracts the effect of BMI1 knockdown. a, Immunoblot analysis of MYCN and BMI1 levels in parental and Tet repressor (Tet-Off)-expressing BE(2)-C cells, and in individual BE(2)-C clones with inducible expression of BMI1 shRNA. The cells were cultured in the presence of Doxy. α-tubulin levels are shown as loading control. b, Immunoblot analysis of BMI1, MYCN and cyclin E1 levels in BMI1-resistant clone-7 and -12 cells cultured in the presence or absence of Doxy for 4 days. β-actin levels are shown as loading control. c, qRT-PCR analysis of FBXW7 mRNA levels in clone-7 and -12 cells cultured in the presence or absence of Doxy for 3 days (error bars, s.d., n=3). d, Immunoblot analysis of BMI1, MYCN and cyclin E1 levels in pooled BMI1-sensitive cells cultured in the presence or absence of Doxy for 5 and 35 days, respectively. β-actin levels are shown as loading control. e, Immunoblot analysis of BMI1, MYCN and cyclin E1 levels in pooled BMI1-sensitive cells infected with retroviruses expressing either GFP or MYCN and cultured in the presence or absence of Doxy for 4 days. β-actin levels are shown as loading control. f, Phase contrast imaging of pooled BMI1-sensitive cells expressing either GFP or MYCN and cultured in the presence or absence of Doxy for 6 days. Scale bars, 100 μm.

