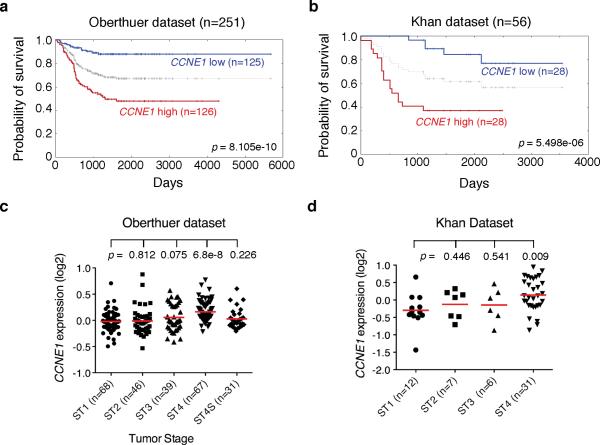
Figure 6.
High CCNE1 expression is associated with Stage 4 neuroblastomas and poor outcome in neuroblastoma patients. a-b, Kaplan-Meier analysis of progression-free survival for Oberthuer (a) and Khan (b) datasets with log-rank test p values indicated. The CCNE1 expression cutoff value 0 (a) or 0.031 (b) was determined by the online Oncogenomics algorithm, which separated the patients into high and low CCNE1 expression groups. c-d, Scatter dot plot of CCNE1 expression levels in stage (ST) 1-4S (c) or 1-4 (d) tumors. Data were analyzed using two-tailed Student`s t-test with p values indicated (ST1 vs ST2, 3, 4 or 4S).

