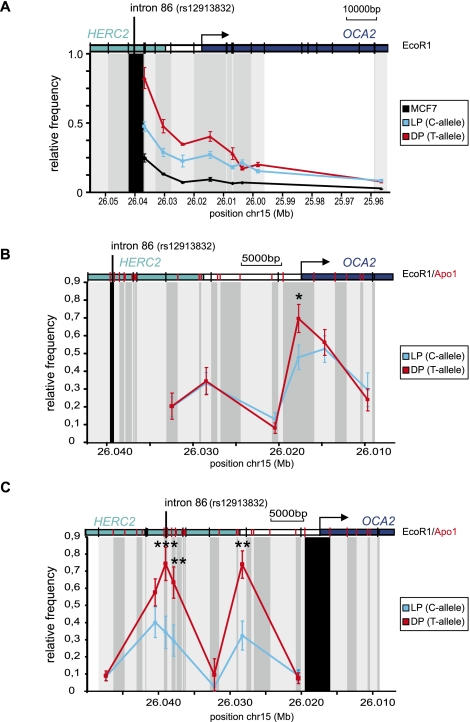
Figure 3.
A chromatin loop is formed between the HERC2 rs12913832 enhancer region and the OCA2 promoter. (A–C) Locus-wide cross-linking frequencies observed in MCF7 (black), HEMn-LP (cyan), and HEMn-DP (red) cells. The analyzed region of the human OCA2-HERC2 locus is depicted on the top of each graph. The x-axis shows the approximate position on chromosome 15 (UCSC Browser NCBI36/hg18 assembly; see also Fig. 1A). (Black shading) The position and size of the “fixed” restriction fragment; (gray shading) position and size of other restriction fragments analyzed. (Black vertical bars in the locus graph) EcoRI sites; (red vertical bars) ApoI sites. The cross-linking frequencies are normalized to the highest interaction within an experiment. (A) Cross-linking frequencies for an EcoRI restriction fragment containing rs12913832 in MCF7 and HEMn cells. In HEMn cells, high cross-linking frequencies are observed for a restriction fragment containing the OCA2 promoter. (B) Cross-linking frequencies for an ApoI restriction fragment containing rs12913832 in HEMn cells. In HEMn cells, high cross-linking frequencies are observed for a restriction fragment containing the OCA2 promoter. Cross-linking frequencies between the restriction fragment containing rs12913832 and the restriction fragment containing the OCA2 promoter are higher for the T-allele (red) than for the C-allele (cyan). (C) Cross-linking frequencies for an ApoI restriction fragment containing the OCA2 promoter in HEMn cells. High cross-linking frequencies with restriction fragments surrounding the rs12913832 enhancer region are observed in HEMn cells. Cross-linking frequencies between the restriction fragment containing rs12913832 and the restriction fragment containing the OCA2 promoter are higher for the T-allele (red) than for the C-allele (cyan). Data are represented as mean ± SEM; (*) p < 0.05; (**) p < 0.01; (***) p < 0.005.

