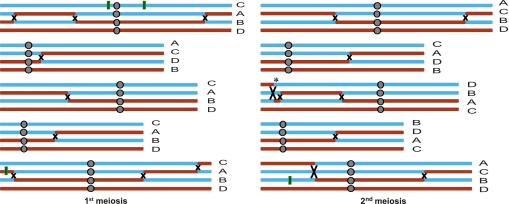
Figure 5.
The distribution of COs and NCOs in the first and second meioses. Either meiosis has nine COs. (Cyan) Col genotype; (red) Ler genotype; (×) location of CO. A, B, C, and D represent four meiotic progeny plants, respectively. Green vertical bars show the detected NCOs positions. One or both of two closely spaced COs (*) in Chr3 from the second meiosis could be from an interference-insensitive pathway.

