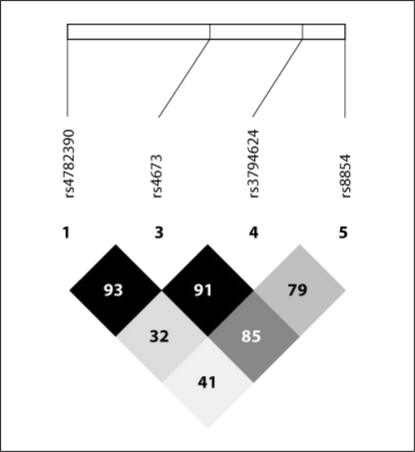
Fig. 2.
CYBA gene locus Haploview plot in the AKI cohort. The Haploview plot was generated on 4 CYBA gene polymorphisms after exclusion of rs1049255, which did not fulfill the Hardy-Weinberg equilibrium. The plot illustrates pairwise LD between all polymorphisms based on D′ values. The darker a rhombus appears, the higher the LD is between the respective polymorphisms.

