
Figure 1.
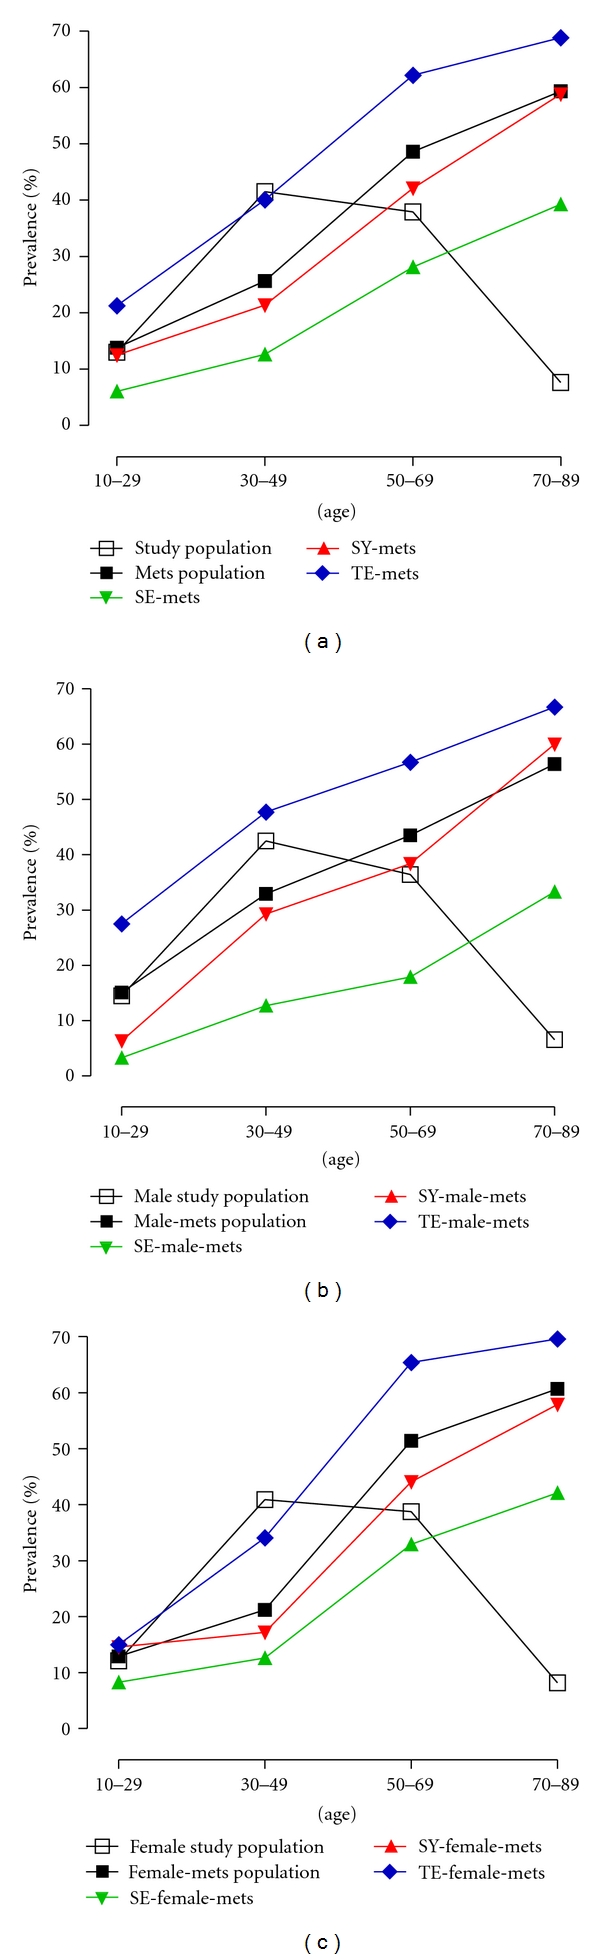
The prevalence of the MS according to SCG. The prevalence of MS according to SCG in total study population (a), male study population (b), and female study population (c) are shown, respectively.
Official websites use .gov
A
.gov website belongs to an official
government organization in the United States.
Secure .gov websites use HTTPS
A lock (
) or https:// means you've safely
connected to the .gov website. Share sensitive
information only on official, secure websites.
The prevalence of the MS according to SCG. The prevalence of MS according to SCG in total study population (a), male study population (b), and female study population (c) are shown, respectively.