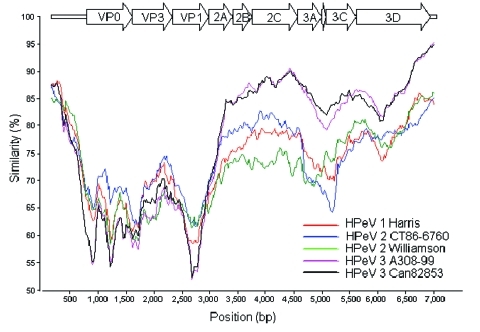
Figure 2.
Similarity plot of human parechovirus serotype 1 (HPeV1) Harris (S45208), HPeV2 Williamson (AJ005695), HPeV2 CT86-6760 (AF055846), HPeV3 A308-99 (AB084913), and Can82853-01 (AJ889918) against K251176-02. Each curve is a comparison between the K251176-02 genome and an HPeV prototype. Each point represents the percentage identity within a sliding window 600 bp wide, centered on the position plotted, with a step size of 20 bp. Positions containing gaps were excluded from the comparison by gap stripping, and Jukes and Cantor correction was applied. Similarity plots of the full-length sequences of the HPeV prototypes were generated by using SimPlot version 2.5.

