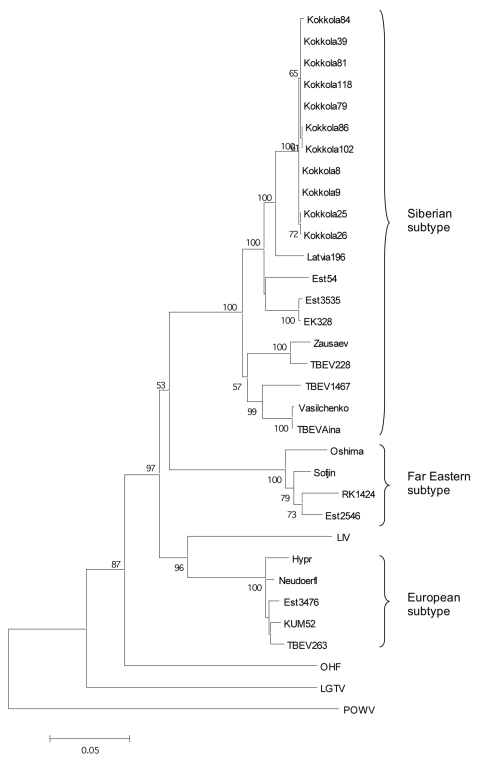
Figure 2.
Maximum likelihood phylogenetic tree of partial E gene (1,076 nt). The bar below indicates the nucleotide substitutions per site. The accession nos. of the strains used can be seen in Table 2. The bootstrap support values <50 are not shown.

