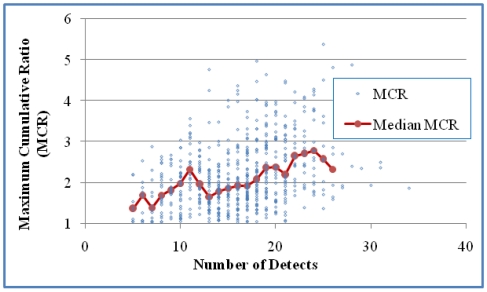
Figure 5.
The relationship between MCR and the number of detects in the samples for Case 1 (618 mixtures). A positive correlation was shown either based on all mixtures (Kendall’s τ = 0.2511 and p < 0.0001) or median MCR of grouped mixtures for groups with at least five values (τ = 0.6826 and p < 0.0001).

