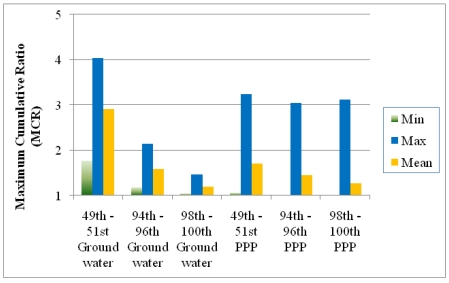
Figure 7.
Comparison of the MCR values in three groups of the mixtures in the surface water samples analyzed for PPPs [1] and the results from this study (ground water samples). The three groups of mixtures were chosen on the basis of HI (mixtures with HI values falling into 49–51st, 94–96th, and 98–100th centile ranges respectively). Min: minimum; Max: maximum.

