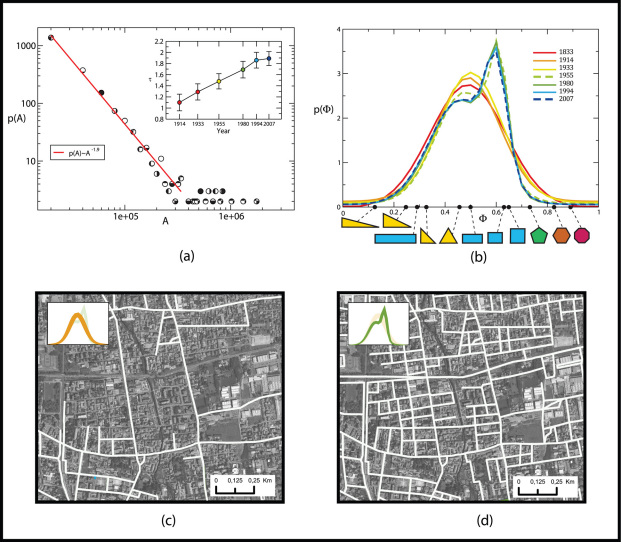
Figure 3.
(a) The size distribution of cell areas at t = 2007 can be fitted with a power-law p(A) ∼ A−τ, with an exponent  . The inset shows the value of τ at different times. (b) Distribution of cell shapes at different times, as quantified by the shape factor Φ. The shape factor of different polygons is reported at the bottom axis for comparison. (c) and (d) Maps showing the cell shapes (white lines) for the network as it is before 1955 (left panel) and as it is after 1955 (right panel). We see on the left panel that we have predominantly triangles and rectangles, while on the right panel we can observe a predominance of rectangles with sides of almost the same length.

