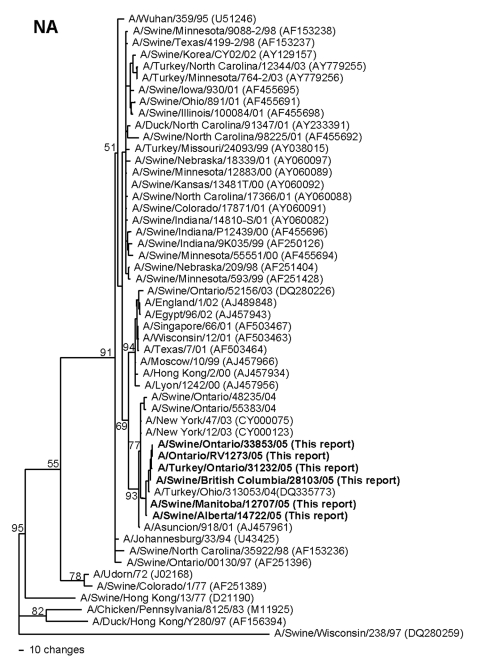
Figure 2.
Nucleotide phylogram for the neuraminidase (NA) genes of A/Swine/Manitoba/12707/05, A/Swine/Alberta/14722/05, A/Swine/British Columbia/28103/05, A/Swine/Ontario/33853/05, A/Turkey/Ontario/31232/05, A/Ontario/RV1273/05, and related reference viruses. The evolutionary relationships among these viruses were estimated by the method of maximum parsimony (PAUP software, version 4.0b10) with a bootstrap resampling method (200 replications) and a fast heuristic search algorithm. Numbers at the nodes of the phylograms indicate the bootstrap confidence levels. Horizontal-line distances are proportional to the minimum numbers of nucleotide changes needed to join nodes and gene sequences. Vertical lines are present to space the branches and labels. GenBank accession numbers for the sequences of all reference viruses are provided in parentheses after the virus names.

