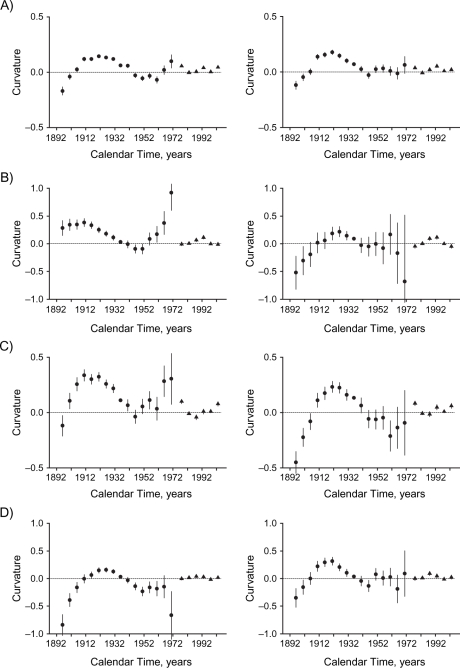
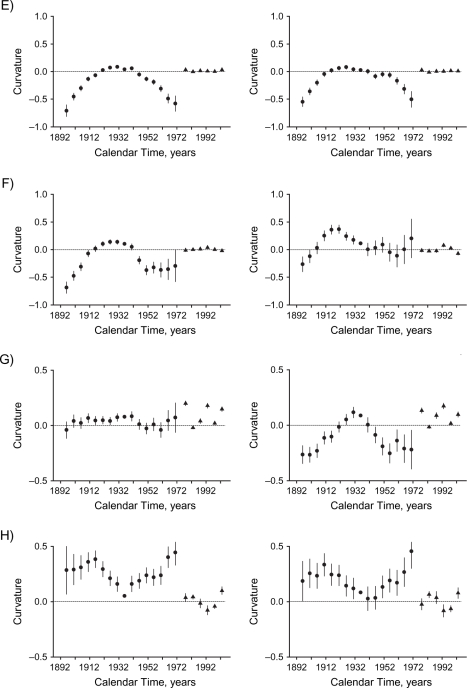
Figure 3.
Curvature components for cohort (circles) and period (triangles) effects of socioeconomic development on mortality in Hong Kong, 1976–2005, among men (left-hand panels) and women (right-hand panels), for: A) all causes, B) ischemic heart disease, C) other cardiovascular diseases excluding ischemic heart disease, D) lung cancer, E) other cancers excluding lung cancer, F) respiratory disease, G) all other medical causes, and H) external causes. Bars, 95% confidence interval.


