Figure 3.
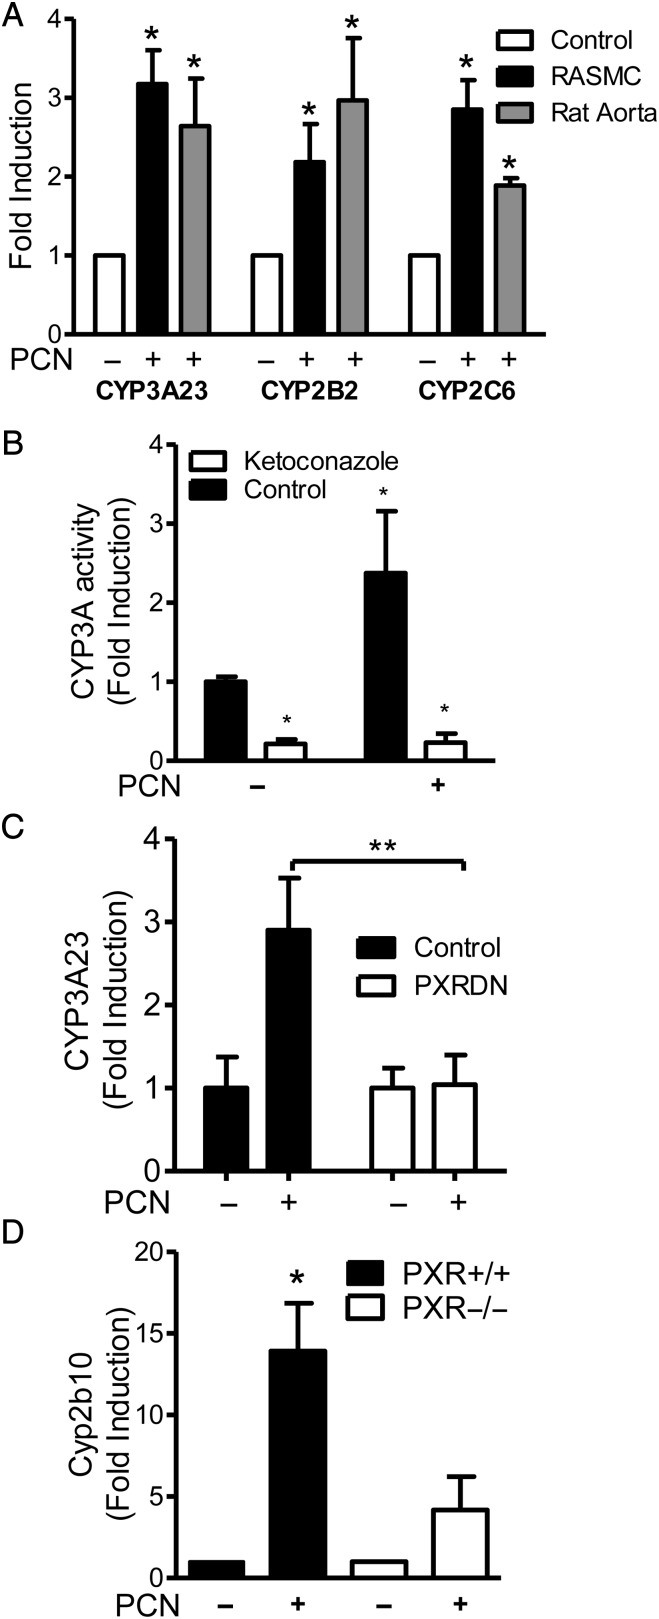
PXR-dependent cytochrome P450 induction. Data represent fold change from vehicle (DMSO)-treated samples ±SE due to 24 h treatment with PCN (10 μmol/L in vitro; 20 mg/kg body weight ip in vivo). (A) Densitometric analysis of semi-quantitative RT–PCR for CYP3A23 (n = 3), CYP2B2 (nRASMC= 6, nAorta= 7), and CYP2C6 (n = 3) in RASMC or ex vivo cultured Wistar rat aorta normalized to β-actin control. (B) CYP3A activity in RASMC was assessed as the conversion of CYP3A luminogenic substrate over 4 h post-PCN treatment, with or without CYP3A inhibitor ketoconazole (10 µmol/L). n = 4 triplicate samples. (C) Real-time PCR for CYP3A23 (n = 3) in RASMC transfected with either control vector or PXR-DN plasmid normalized to GAPDH control. (D) Real-time RT–PCR for Cyp2b10 (n = 3) on in vivo treated wild-type and PXR-null mice aorta, normalized to GAPDH control. *P < 0.05 vs. vehicle (A, B, one-sample t-test; D, Mann–Whitney non-parametric test). **P < 0.01 two-way ANOVA with Bonferroni's multiple comparison test.

