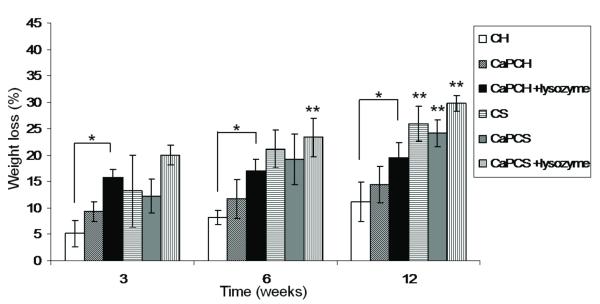
Figure 1.
Weight loss profile of different groups after subcutaneous implantation for up to 12 weeks. Results are expressed as means ± standard deviation with n = 3 for each bar. (*) indicates a significant difference (p < 0.05) between groups at the same time point. (**) indicates a significant difference (p < 0.05) between the same condition at different time points.

