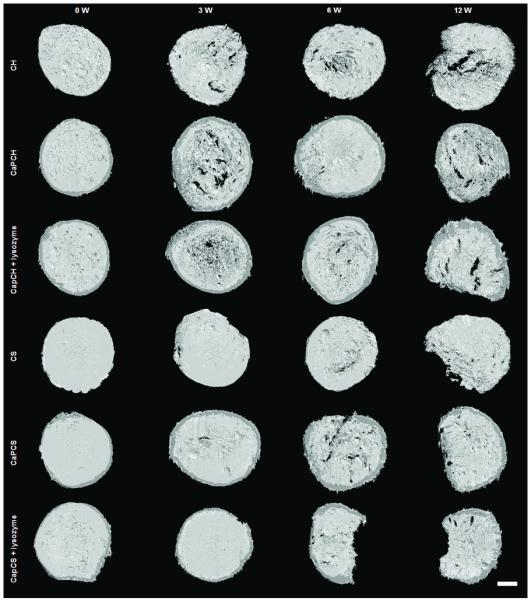
Figure 2.

Images of chitosan-based scaffolds obtained by μ-CT: before implantation (week 0 - control) and after 3, 6 and 12 weeks of subcutaneous implantation. The scale bar is 1 mm and applies to all images.

Images of chitosan-based scaffolds obtained by μ-CT: before implantation (week 0 - control) and after 3, 6 and 12 weeks of subcutaneous implantation. The scale bar is 1 mm and applies to all images.