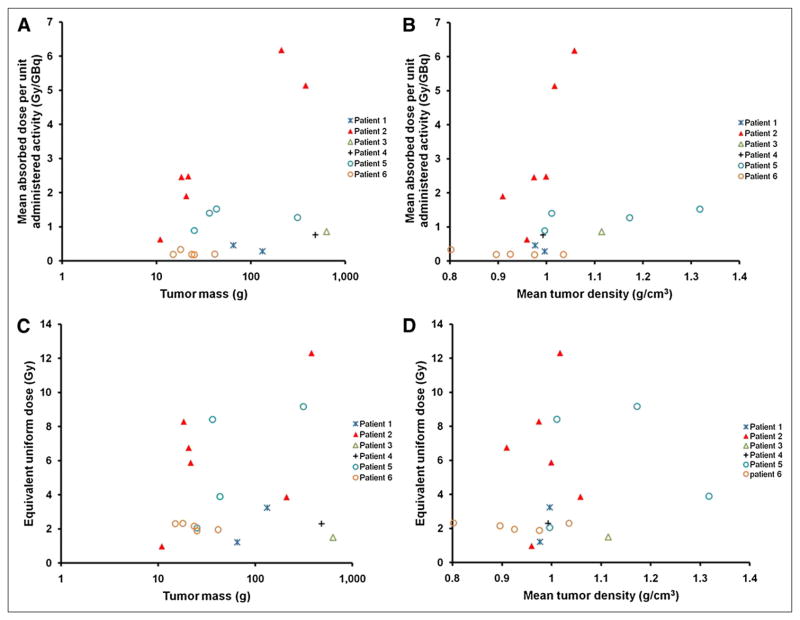
FIGURE 2.
Patient-specific 3D-RD tumor dosimetry analyses. Plots of tumor mass and mean tumor density against mean tumor-absorbed dose per unit administered activity (A and B, respectively) and tumor mass and mean tumor density dependence of equivalent uniform dose (C and D, respectively) are shown. Tumor mass is plotted in logarithmic scale in A and C.

