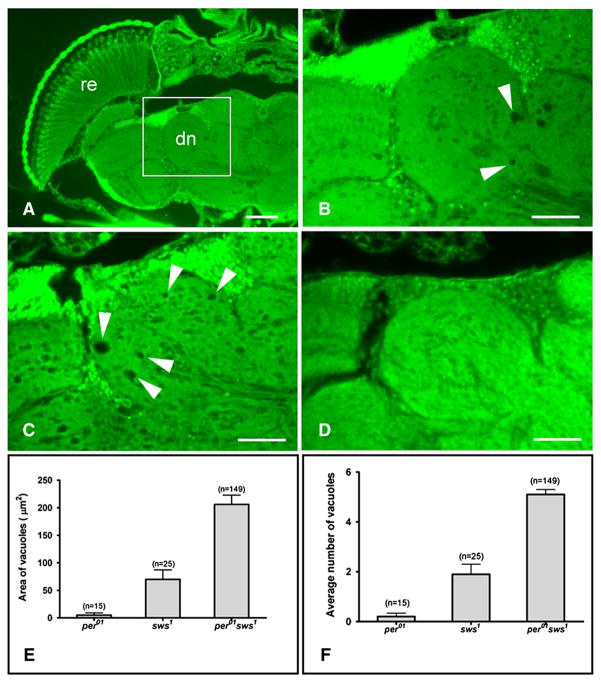
Fig. 7.
Loss of per function increases neurodegeneration in sws mutants. A) Paraffin head sections from a 14 day-old sws1 fly show widespread degeneration (arrows) characteristic for this mutant (scale bar=50 μm, re=retina, ol=optic lobes, dn=deutocerebral neuropil). B) Magnification from A (box), showing the deutocerebral neuropil that was used for measurements. C) Age-matched per01 sws1 double mutants show increase in the size and number of vacuoles compared to sws1 single mutants. D) Age-matched y w control does not show vacuoles in this area. B–D) Scale bar=25 μm. E) Bar graph showing significant difference in the mean area of all vacuoles in the deutocerebral neuropil between sws1 and per01 sws1 (p=1.9×10⁻⁸). F) The mean number of vacuoles/brain hemisphere is also significantly higher in the double mutant compared to sws1 alone (p=0.0033). E–F) The number of brain hemispheres (n) examined to calculate average values is indicated on the top of each bar.

