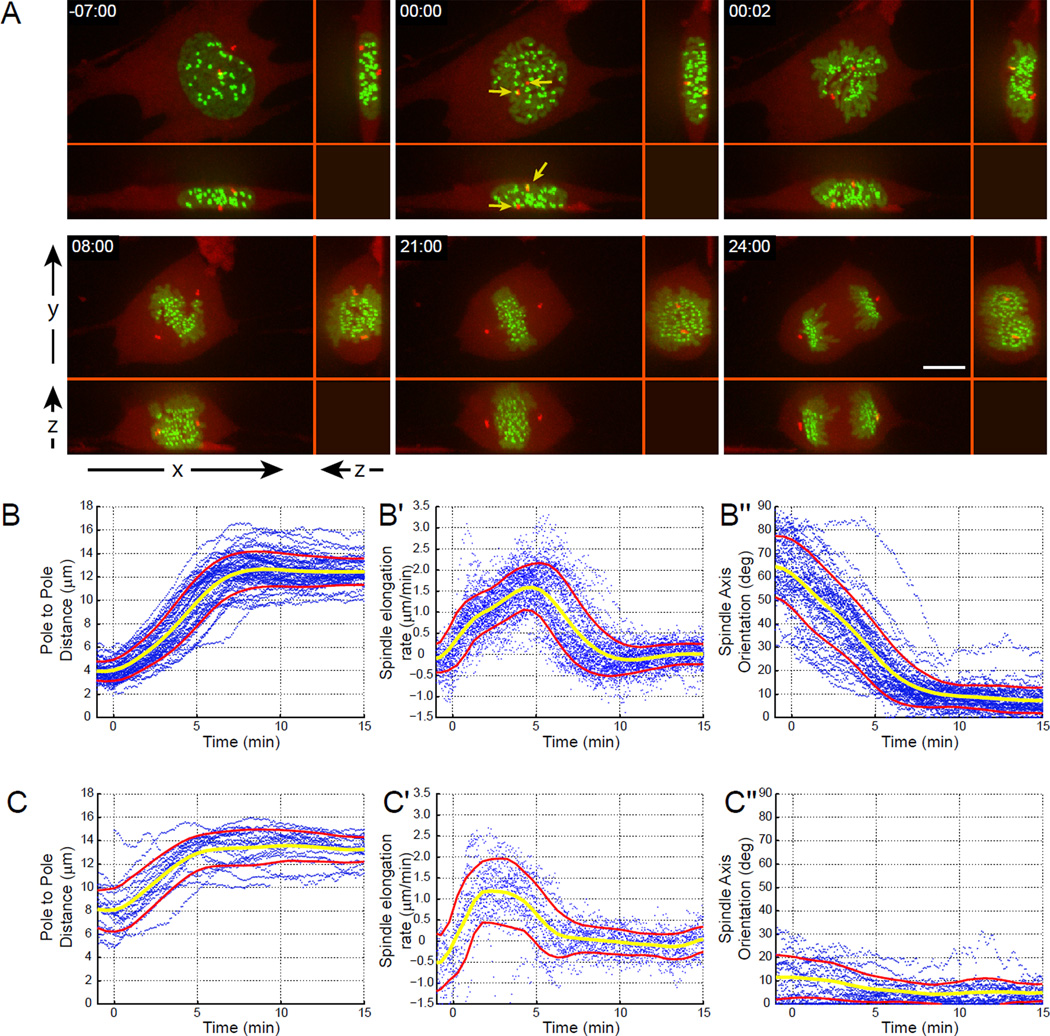
Figure 1. The pattern of spindle elongation and orientation in RPE1 cells.
(A) An RPE1 cell expressing CENP-A-GFP (green) to label the kinetochores and centrin1-tdTomato (red) to label the centrosomes is shown. Although in XY view the centrosomes appear to reside in a common complex just before NEB (arrows in 00:00), XZ and YZ views demonstrate that the centrosomes are actually positioned on the opposite sides of the nucleus (above and below). (B–C) Numeric characterization of spindle elongation and orientation in 67 RPE1 cells co-expressing centrin-GFP and CENP-A-PAGFP. Each plot presents individual trajectories (blue dots), the average value (yellow line), and standard deviation (red lines). Spindle length (B, C), rate of spindle elongation (B’, C’), and spindle orientation (B”, C”) in V- (B–B”) vs. H-cells (C–C”). Note the remarkable reproducibility of spindle elongation and rotation pattern.

