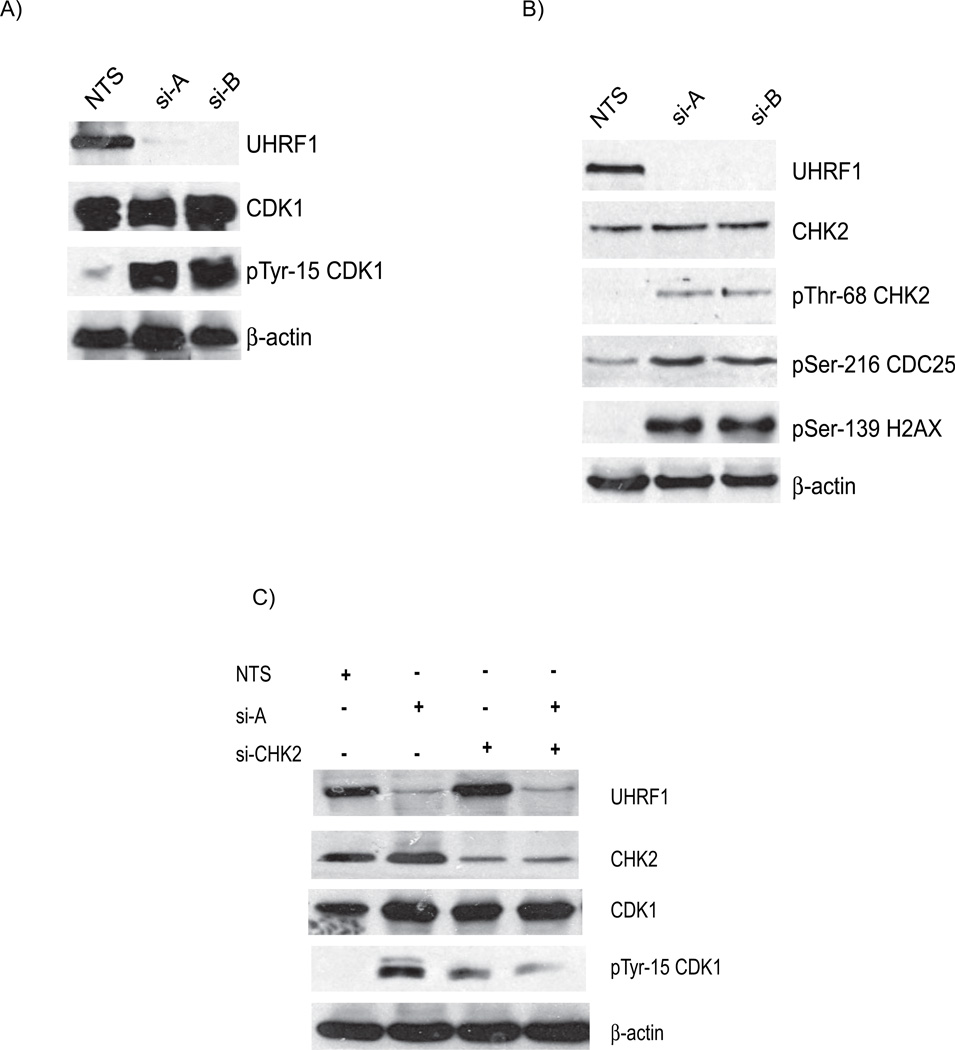
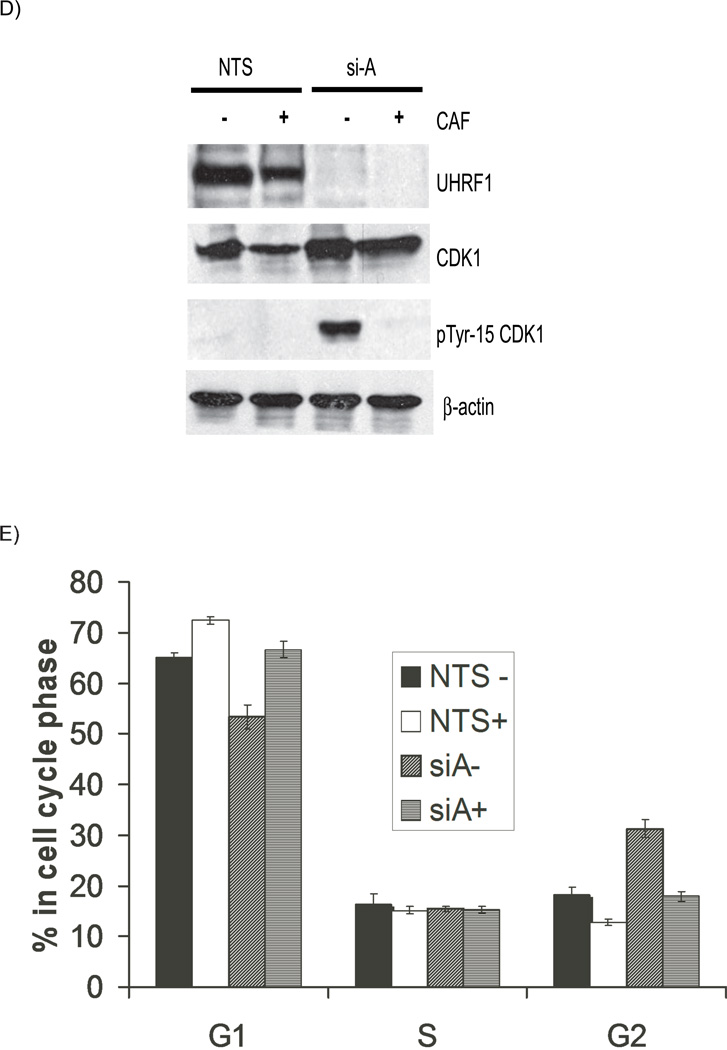
Figure 2. Depletion of UHRF1 activates the DNA damage response pathway.
A). Western immunoblots show similar levels of total cellular CDK1 (panel 2) but there are enhanced levels of tyrosine 15 phosphorylated CDK1 in UHRF1 depleted cells (panel 3, compare lanes 2 and 3 with 1). B). Additional markers of DNA damage response are present in UHRF1 depleted cells. Total CHK2 is unchanged (panel 2) but CHK2 is phosphorylated on threonine-68 (panel 3), CDC25C is phosphorylated on serine-216 (panel 4) and histone H2AX is phosphorylated on serine-139 (panel 5). β-actin is used as a loading control for the experiments above. C) Knockdown of CHK2 in UHRF1 depleted cells reduces tyrosine-15 phosphorylation. The increased tyrosine-15 phosphorylation of CDK1 seen in UHRF1 depleted cells (lane 2, panel 4) is reduced when CHK2 is concurrently knocked down (lane 4, panel 4). si-CHK2 represents siRNA against CHK2. D). Caffeine abrogates the G2/M checkpoint in UHRF1 depleted cells. The marked tyrosine-15 phosphorylation of CDK1 in UHRF1 depleted cells (panel 3, lane 3) is absent in UHRF1 deficient cells treated with caffeine (CAF). CDK1 levels for NTS transfected cells are similar (panel 2, lanes 1 and 2) as well as for si-A transfected cells (panel 2, lanes 3 and 4). E) Representative FACS analysis of caffeine treated cell. Percentage of cells at various stages of the cell cycle following caffeine treatment. NTS represents UHRF1 containing cells while si-A represents UHRF1 depleted cells. + and − represent the presence or absence of caffeine. Error bars represent standard deviations from the mean of replicates. Note that caffeine abrogates the increase in G2/M population seen with UHRF1 depletion.


