
Figure 4.
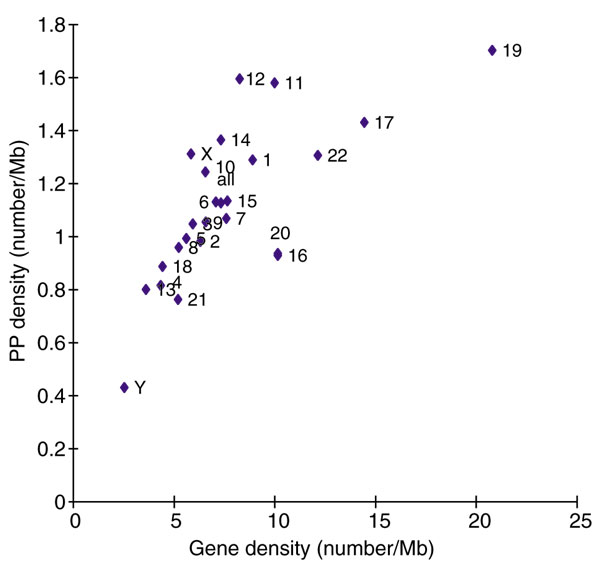
PP and gene density within each chromosome. For each chromosome, the number of PPs per megabase is plotted against the number of genes per megabase.
Official websites use .gov
A
.gov website belongs to an official
government organization in the United States.
Secure .gov websites use HTTPS
A lock (
) or https:// means you've safely
connected to the .gov website. Share sensitive
information only on official, secure websites.
PP and gene density within each chromosome. For each chromosome, the number of PPs per megabase is plotted against the number of genes per megabase.