
Figure 5.
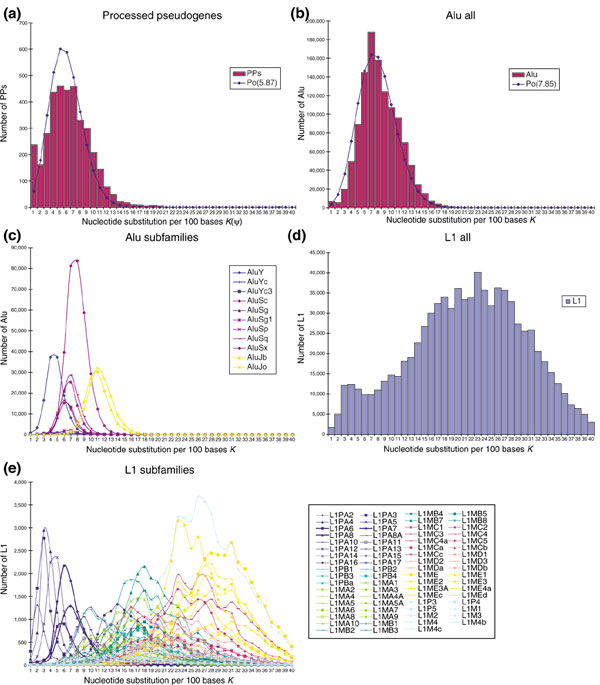
Age distribution of human retroposons represented by the level of nucleotide substitutions. (a) Human PPs. The number of nucleotide substitutions per 100 bases (except CpG sites) was calculated for each PP, and the total number of PPs having a given number of substitutions is shown as individual bars in one-nucleotide increments. For comparison, the line shows a Poisson distribution of the same average values for PPs. (b) Alu repeats, calculated and presented as in (a). The line shows a Poisson distribution of the same average values for Alus. (c) Alu subfamilies, calculated as in (a). The curves connect apices of respective bars calculated as in (a). For simplicity, subfamilies that contain less than 5,000 Alus, such as Alu Ya and Yb, are not shown. (d) L1s, calculated and presented as in (a). (e) L1 subfamilies, calculated and presented as in (c). For simplicity, subfamilies that contain less than 1,000 L1s, such as L1PA1 (L1Hs) and L1P1, are not shown. L1PA6, L1PA7 and L1PA8 are shown as bold blue lines.