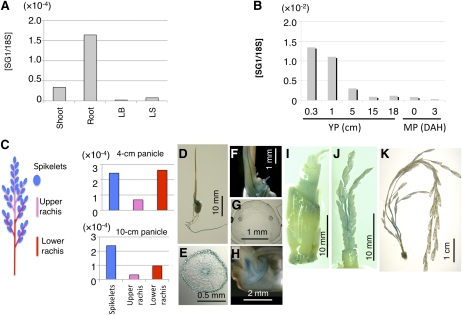
Figure 4.
Expression analysis of SG1 using qPCR and SG1::GUS transgenic plants. A and B, qPCR analysis of SG1 in various organs of wild-type plants. Expression of SG1 was normalized using 18S rRNA. A, Vegetative organs. Shoots and roots of 10-d-old seedlings and leaf blades (LB) and leaf sheaths (LS) of 2-month-old plants were used. B, Reproductive organs. Young panicles (YP) at 0.3, 1, 5, 15, and 18 cm and mature panicles (MP) at 0 and 3 d after heading (DAH) were used. C, qPCR analysis of SG1 in various parts of the young panicle. Schematic representation of the rice panicle (left). Young panicles were dissected into three parts: spikelets, upper rachis, and rachis branches, and lower rachis and rachis branches. These parts were then used for qPCR analysis (right). qPCR analyses are shown for SG1 in the young panicles at the 4-cm stage and the 10-cm stage. Expression of SG1 was normalized using 18S rRNA. D to K, Histochemical staining of transgenic plants harboring the SG1::GUS construct. D to H, Seven-day-old seedlings: Views are of the whole plant (D), a cross section of the seminal root (E), a close-up of the coleoptile (F), a cross section of the coleoptile (G), and a cross section of the embryo (H). I, Vegetative node of the 2-month-old plant. J and K, Young panicles: at the 2-cm stage (J) and 10-cm stage (K) are shown.

