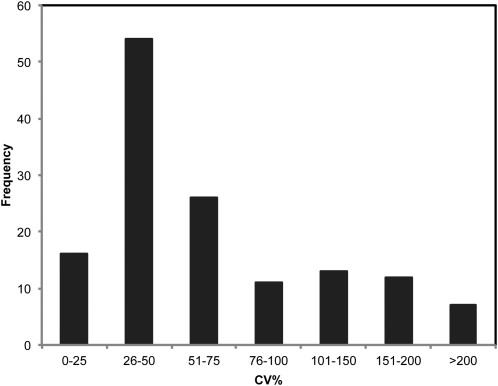
Figure 1.
Histogram of the distribution of metabolic variation. Data shown are based on the percentage of Coefficient of Variation (CV%) across the C × E population for the 139 representative masses. The distribution shows that the majority of metabolites have a CV higher than 50%, indicating a high level of variability.

