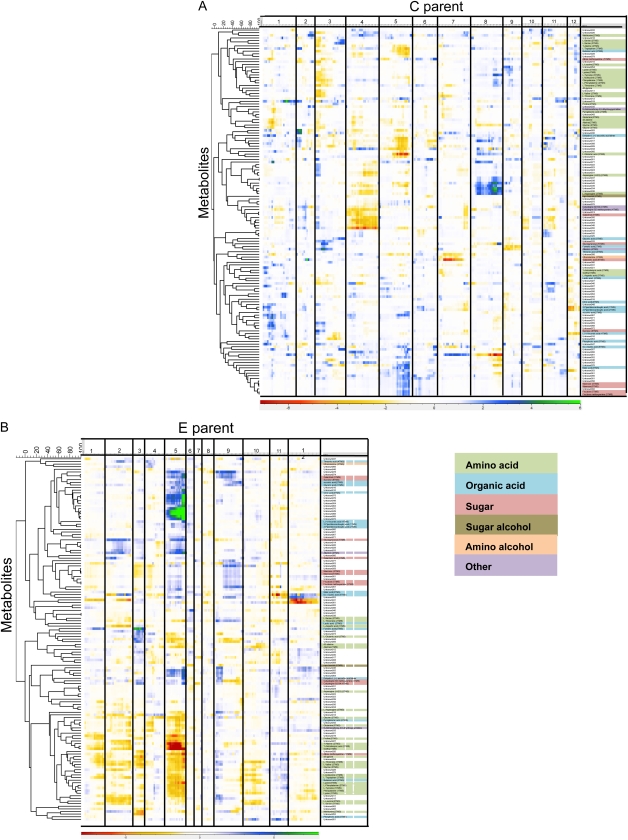
Figure 3.
Heat map of mQTL profiles of the detected compounds in the C × E population. A, Using the genetic map of the C parent. B, Using the genetic map of the E parent. Metabolites are clustered according to −10log(p) values across significantly associated markers. Vertical lines indicate chromosomal borders. Colors indicate the sign of the additive effect and the significance of the mQTL.

