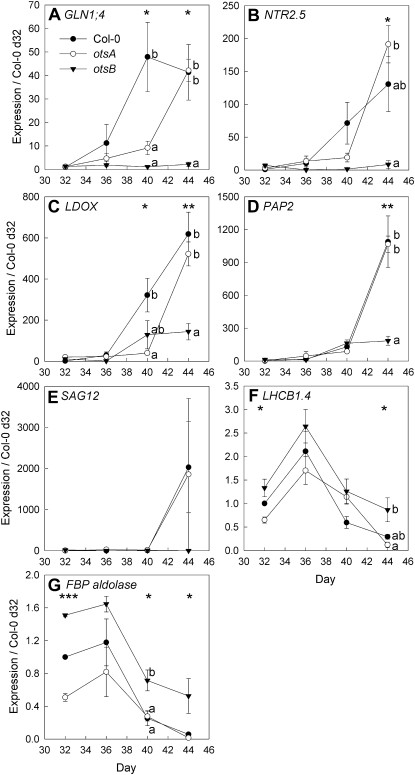
Figure 4.
Senescence-dependent changes in gene expression determined by quantitative RT-PCR in leaves 9 and 10 of wild-type Col-0 (black circles) and transgenic plants expressing the TPS gene, otsA (white circles), or the TPP gene, otsB (black triangles). A, Cytosolic glutamine synthetase 1;4 (GLN1;4; At5g16570). B, High-affinity nitrate transporter 2.5 (NTR2.5; At1g12940). C, Leucoanthocyanidin dioxygenase (LDOX; At4g22880). D, Anthocyanin pigment 2 protein (PAP2 = MYB90; At1g66390). E, Senescence-associated gene 12 (SAG12; At5g45890). F, Chlorophyll a/b-binding protein (LHCB1;4; At2g34430). G, Fructose-bisphosphate aldolase (FBP aldolase; At4g26530). Expression ratios are presented relative to Col-0 values on day 32. Data are means of three plants ± se. Asterisks indicate significant differences (ANOVA) between the three genotypes for each time point: * P ≤ 0.05, ** P ≤ 0.01, *** P ≤ 0.001. Different letters indicate significant differences between the genotypes (P ≤ 0.05; Tukey’s pairwise comparison).

