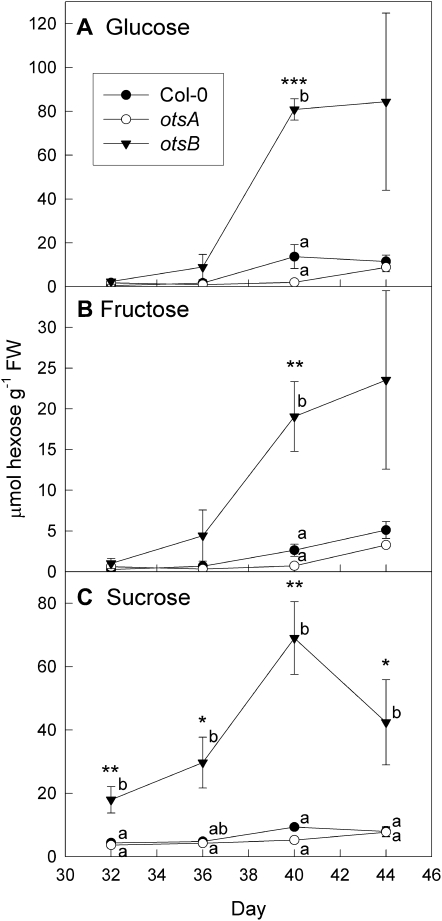
Figure 5.
Sugar contents during senescence in wild-type Col-0 (black circles) and transgenic plants expressing the TPS gene, otsA (white circles), or the TPP gene, otsB (black triangles). A, Glc. B, Fru. C, Suc. Data are means ± se of three plants. Asterisks indicate significant differences (ANOVA) between the three genotypes for each time point: * P ≤ 0.05, ** P ≤ 0.01, *** P ≤ 0.001. Different letters indicate significant differences between the genotypes (P ≤ 0.05; Tukey’s pairwise comparison). FW, Fresh weight.

