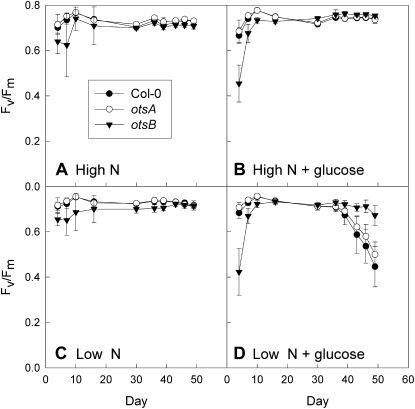
Figure 7.
Whole-rosette Fv/Fm values in wild-type Col-0 (black circles) and transgenic plants expressing the TPS gene, otsA (white circles), or the TPP gene, otsB (black triangles), during growth on low-nitrogen (4.7 mm; Low N; C and D) or high-nitrogen (30 mm; High N; A and B) medium without (A and C) or with (B and D) the addition of 111 mm Glc. Data are means of at least 16 plants ± sd.

