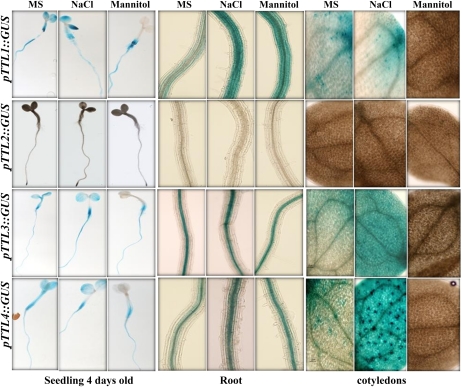
Figure 8.
TTL genes show differential expression responses to NaCl and mannitol stresses. Transgenic lines harboring TTL promoter::GUS fusions were grown for 4 d and then transferred to control medium or medium supplemented with 120 mm NaCl or 300 mm mannitol for 24 h before staining for GUS activity. The images show whole seedlings, roots, and cotyledons.

