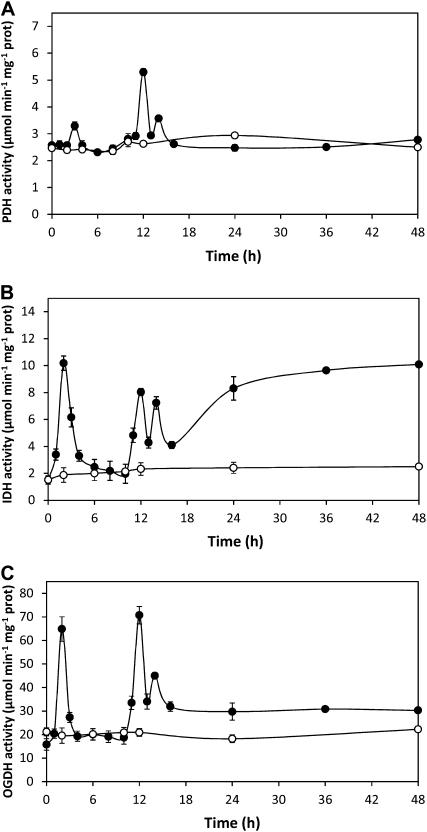
Figure 3.
Activities of Krebs cycle enzymes PDH (A), IDH (B), and OGDH (C) in extracts of U. compressa cultivated in control condition (white circles) and exposed to 10 μm copper (black circles) for 48 h. Activities are expressed as micromoles per minute per milligram of protein. Symbols represent mean values of three independent experiments ± sd. Different letters indicate significant differences (P < 0.05).

