Figure 5.
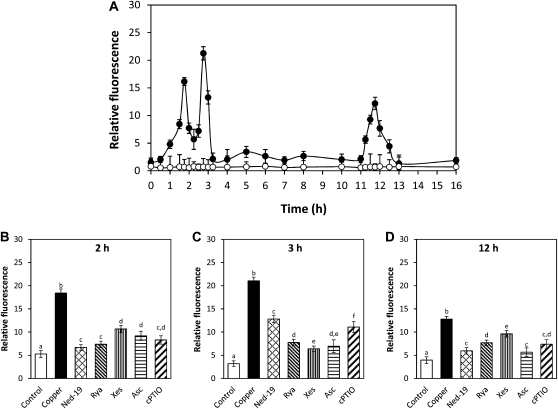
Level of intracellular calcium in U. compressa (A) cultivated in control condition (white circles) and with 10 μm copper (black circles). Calcium level is expressed as the ratio of Fluo 3 fluorescence and chloroplast autofluorescence. Level of calcium in the alga cultivated in control condition (control), exposed to 10 μm copper (copper), or treated with 10 μm ned-19, 100 μm ryanodine (rya), 10 μm xestospongin C (xes), 1 mm ASC, or 0.1 mm cPTIO and exposed to 10 μm copper for 2 h (B), 3 h (C), and 12 h (D). Bars represent mean values of three independent experiments ± sd. Different letters indicate significant differences (P < 0.05).

