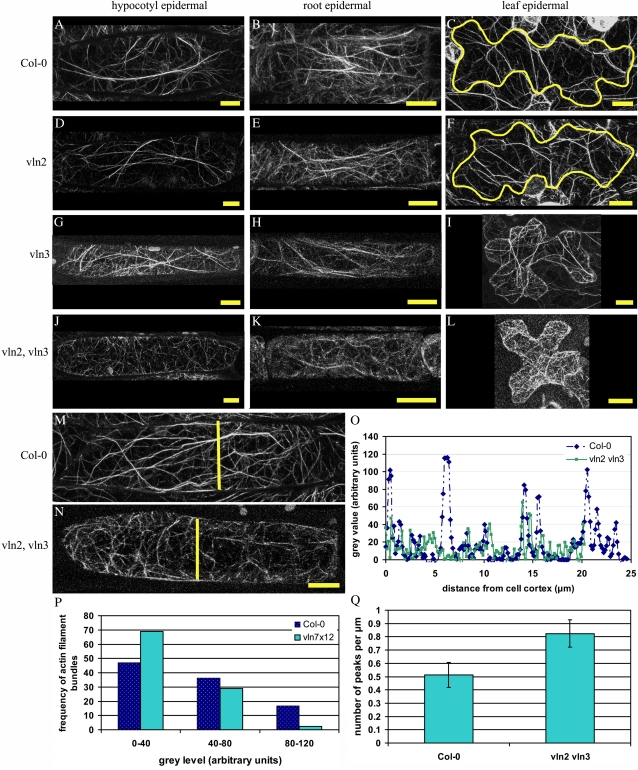
Figure 4.
Thick actin bundles are absent in vln2 vln3, but thin bundles of actin filaments are more prominent. A to L, The actin organization (visualized with GFP:FABD2) in cells of both single mutants (D–I) is similar to that in Col-0 cells (A–C): thick bundles of actin filaments alternate with a more complex network of thin (bundles of) actin filaments. In the double mutant (J–L), thick actin filament bundles appear to be absent, while thin actin filament bundles seem more prominent. M to O, Representative intensity profiles of fluorescence intensity in a Col-0 (M) and a vln2 vln3 (N) fully elongated hypocotyl cell. High peaks represent thick actin filament bundles, while lower peaks represent thinner bundles. The yellow lines in M and N show the locations of the intensity profile in O. P, Frequency distribution of peaks belonging to three fluorescence intensity classes (determined for six cells for each genotype) in Col-0 and vln2 vln3. In Col-0 cells, peaks with a fluorescence intensity of 80 to 120 (representing thick actin filament bundles) are more abundant than in vln2 vln3, while peaks with a fluorescence intensity of 0 to 40 (representing thin[ner] actin filament bundles) are more abundant in vln2 vln3. Q, The number of peaks per micrometer shown for Col-0 and vln2 vln3. vln2 vln3 cells contain significantly more (Student’s t test, P = 0.04) actin filament bundles than Col-0 cells. Bars in A to N = 10 μm. Error bars in Q represent se. [See online article for color version of this figure.]

