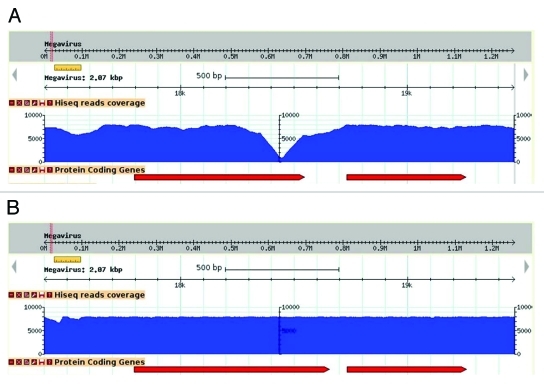
Figure 1.
Effect of sequence correction on read coverage. Visualization of read coverage (blue histogram) resulting from the mapping of Illumina high-throughput sequences at the same genomic locus, prior (A) and following (B) sequence correction. In this example, the deletion of an adenine in an 8-fold A-homopolymer resulted in an increase of coverage where it initially formed a steep drop, and a lengthening of the overlapping ORF (red arrows).

