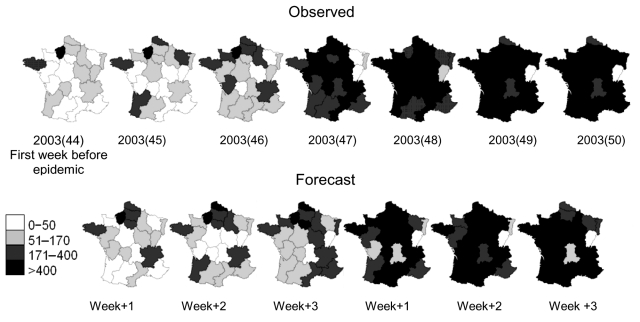
Figure 3.
Evolution of regional influenzalike illness (ILI) incidence during the 2003–04 epidemic. The observed maps (first line) were constructed by using data from the French Sentinel Network. The forecast maps (for the first 6 epidemic weeks) 1, 2, and 3 weeks ahead show the results of the regional models when medication sales are used. The forecast horizon is indicated below each map. For example, for 2003(49), ILI predicted incidence is calculated by employing the model with data until week 47 of year 2003. Thus, the time forecasting horizon is 2 weeks.

