
Figure 1. Classification of KRAS mutant colon cancer cells into KRAS-independent and KRAS-dependent groups.
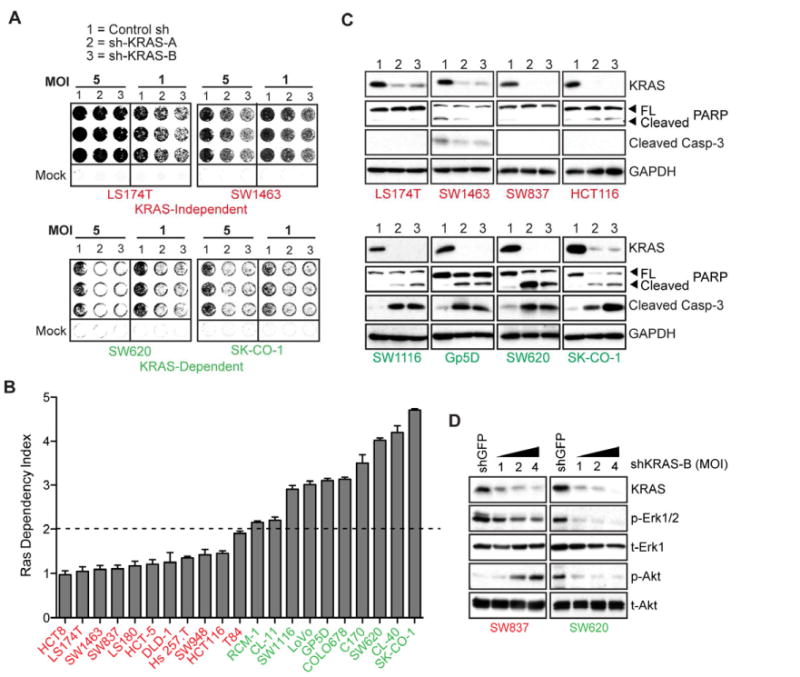
(A) Representative 6-day 96-well viability assays in 4 KRAS mutant colon cancer cell lines transduced with either control or 2 independent KRAS-directed lentiviral shRNAs (A and B), at 2 viral MOIs. Cell lines in red text are KRAS-independent, and those in green text are KRAS-dependent. Quantitation and transformation of relative cell density values yields the Ras Dependency Index depicted in Fig. 1B.
(B) Ras Dependency Index plot for a panel of 21 KRAS mutant colon cancer cell lines. Dashed line represents the “Dependency Threshold” of 2.0. Data are presented as the mean of three independent experiments +/- SEM.
(C) KRAS protein depletion 4 days post-infection with KRAS-directed shRNAs and effects on apoptosis, as assessed by caspase-3 and PARP cleavage, in a representative panel of KRAS-dependent versus-KRAS independent cell lines. Lanes 1, 2 and 3 are as in panel A. Data is representative of two independent experiments.
(D) Activating phosphorylations of the Erk (p-Erk1/2) and Akt (p-Akt) kinases, following KRAS depletion in SW837 KRAS-independent versus SW620 2 KRAS-dependent cells, 4 days post-infection with 3 different viral titres (MOIs of 1, 2 and 4) of shKRAS-B. Total protein levels (t-Erk1 and and t-Akt) are shown as gel loading controls. Note: different exposure times were used for the individual panels. Data is representative of two independent experiments.