
Figure 4. Associations between the KRAS dependency gene set, TAK1 dependence and KRAS-driven canonical Wnt signaling in colon cancer patients.
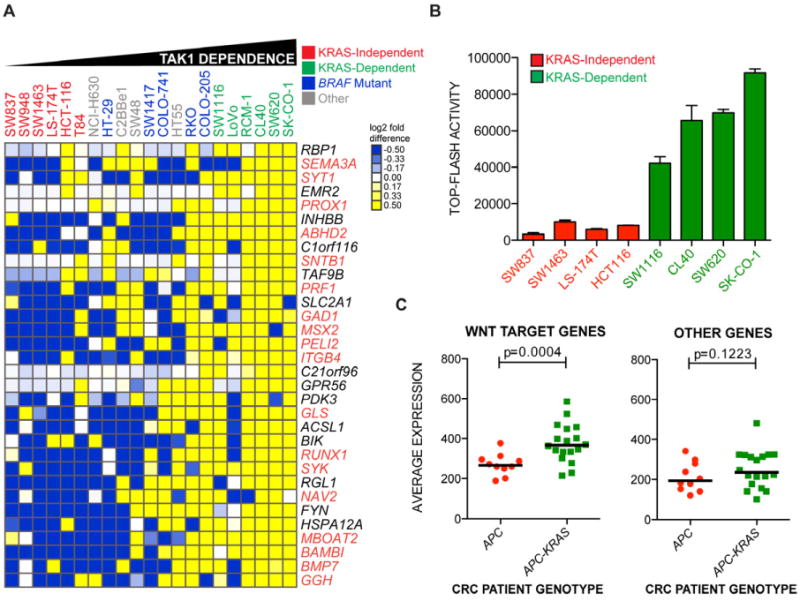
(A) Heat map representation of gene expression most correlated with TAK1 dependence from the KRAS dependency gene set across a panel of colon cancer cell lines of various genotypes. Cell lines are ordered by IC50 values for 5Z-7-oxozeaenol, leftmost being the highest and rightmost being the lowest. Clustering of genes was performed with Euclidean distance as a similarity metric. Values are presented as log2 median-centered intensities. Genes highlighted in orange text are putative or bona fide TCF4 target genes.
(B) Basal normalized TCF4 luciferase reporter activity (TOP-FLASH) in nominal units for a panel of KRAS-independent and KRAS-dependent colon cancer cell lines. Data are represented as the means of 3 independent experiments +/- SEM.
(C) Average expression of non-TCF4 or TCF4 target genes depicted in Figure 4A in colon cancer patients genotyped as either APC mutant/KRAS-wild-type (red circles) or APC mutant plus KRAS mutant (green squares). P-values represent a comparison of mean expression scores of genes for each class.
See also Figure S3.