
Figure 5. KRAS and TAK1 regulate canonical Wnt signaling in KRAS-dependent cancer cells.
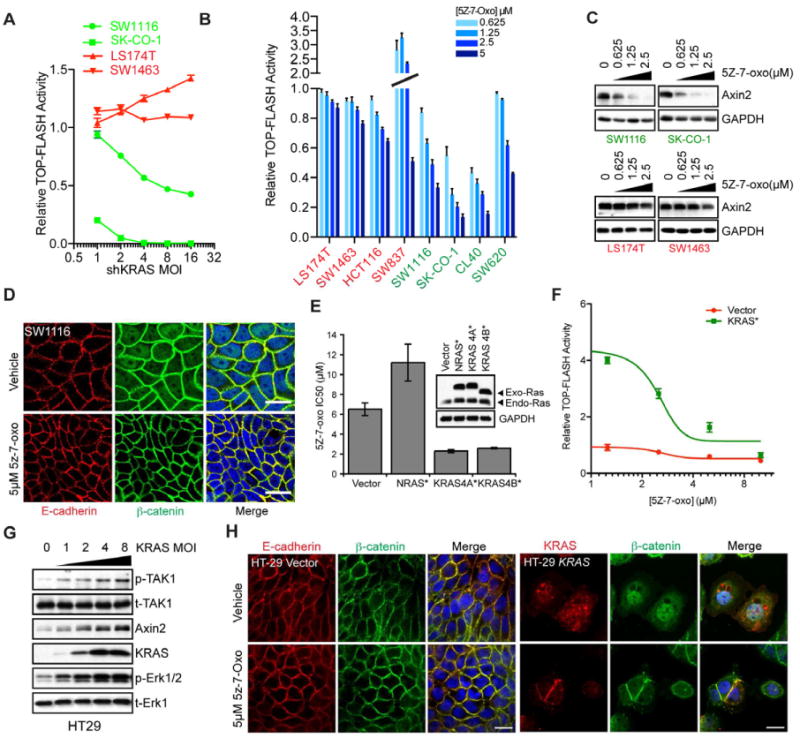
(A) TOP-FLASH luciferase reporter activity as a function of lentiviral shRNA-mediated KRAS depletion at increasing MOIs in LS174T/SW1463 (KRAS-independent) versus SW620/SK-CO-1 (KRAS-dependent) cells. Cell lines were transduced to stably express luciferase under the control of TCF4 response elements. Reporter activity is plotted relative to shGFP (vector) expressing cells. Data are represented as the mean of triplicate experiments +/- SEM.
(B) TOP-FLASH activity in KRAS-independent and KRAS-dependent cell lines following TAK1 inhibition with increasing concentrations of 5Z-7-oxo (μM). Data are represented as means of triplicate experiments ± SEM.
(C) Protein expression levels of the endogenous Wnt target gene Axin 2 following treatment of cells with the indicated concentrations of 5Z-7-oxo. GAPDH serves as a loading control.
(D) Laser confocal micrographs of SW1116 KRAS-dependent cells treated with either DMSO vehicle or 5μM 5Z-7-oxo for 24h. E-cadherin localization is shown in the red channel, β-catenin in green and DAPI-stained nuclei are in blue. Scale bar = 20μM.
(E) Forced overexpression of epitope-tagged oncogenic G12V mutated RAS protein isoforms in HT29 cells and sensitivity to TAK1 pharmacological inhibition with 5Z-7-oxozeaenol. Expression levels of exogenous and endogenous Ras proteins are shown by immunoblotting with a pan-ras monoclonal antibody. NRAS/KRAS4B are HA-tagged and KRAS4A is V5-tagged.
(F) Overexpression of mutant KRAS(12V) followed by TAK1 inhibition in HT29 cells and effects on TOP-FLASH reporter activity. Data are presented as the means of three independent experiments +/- SEM.
(G) Overexpression of KRAS(12V) in HT29 cells and effects on TAK1 and Erk phosphorylation (p-TAK1/p-Erk) as well as Axin 2 levels. Total TAK1 and Erk1 serve as loading controls.
(H) Confocal micrographs showing E-cadherin or KRAS (red) and β-catenin (green) localization in vector control or oncogenic HA tagged KRAS-4B(12V) expressing HT29 cells. KRAS expression is visualized using an HA polyclonal antibody. Scale bar = 25μm.
See also Figure S4.